
Map the Flow of Work: A Leader’s Blueprint for Speed
The ruthless advantage of mapping the flow
If you cannot draw how value moves from request to cash in your top two revenue streams in under 30 minutes, you are not managing. You are guessing. And the guesswork is costing you speed, trust, and margin.
Most leaders can show you a plan. Fewer can show you the path. Almost none can show you the waiting time between steps, the rework loops, or the decision bottlenecks that turn good strategy into slow delivery. That is the brutal truth. The good news is you can fix it, fast, if you map the flow of work and lead from it.
This is a practical playbook for senior leaders who want to move the needle in weeks, not quarters.
What is “map the flow of work” and why it matters
Mapping the flow of work is the discipline of making end-to-end value creation visible, measurable, and manageable. It is not a pretty process diagram. It is a living system view of how demand becomes value for a customer and cash for the business, across teams, tools, and time.
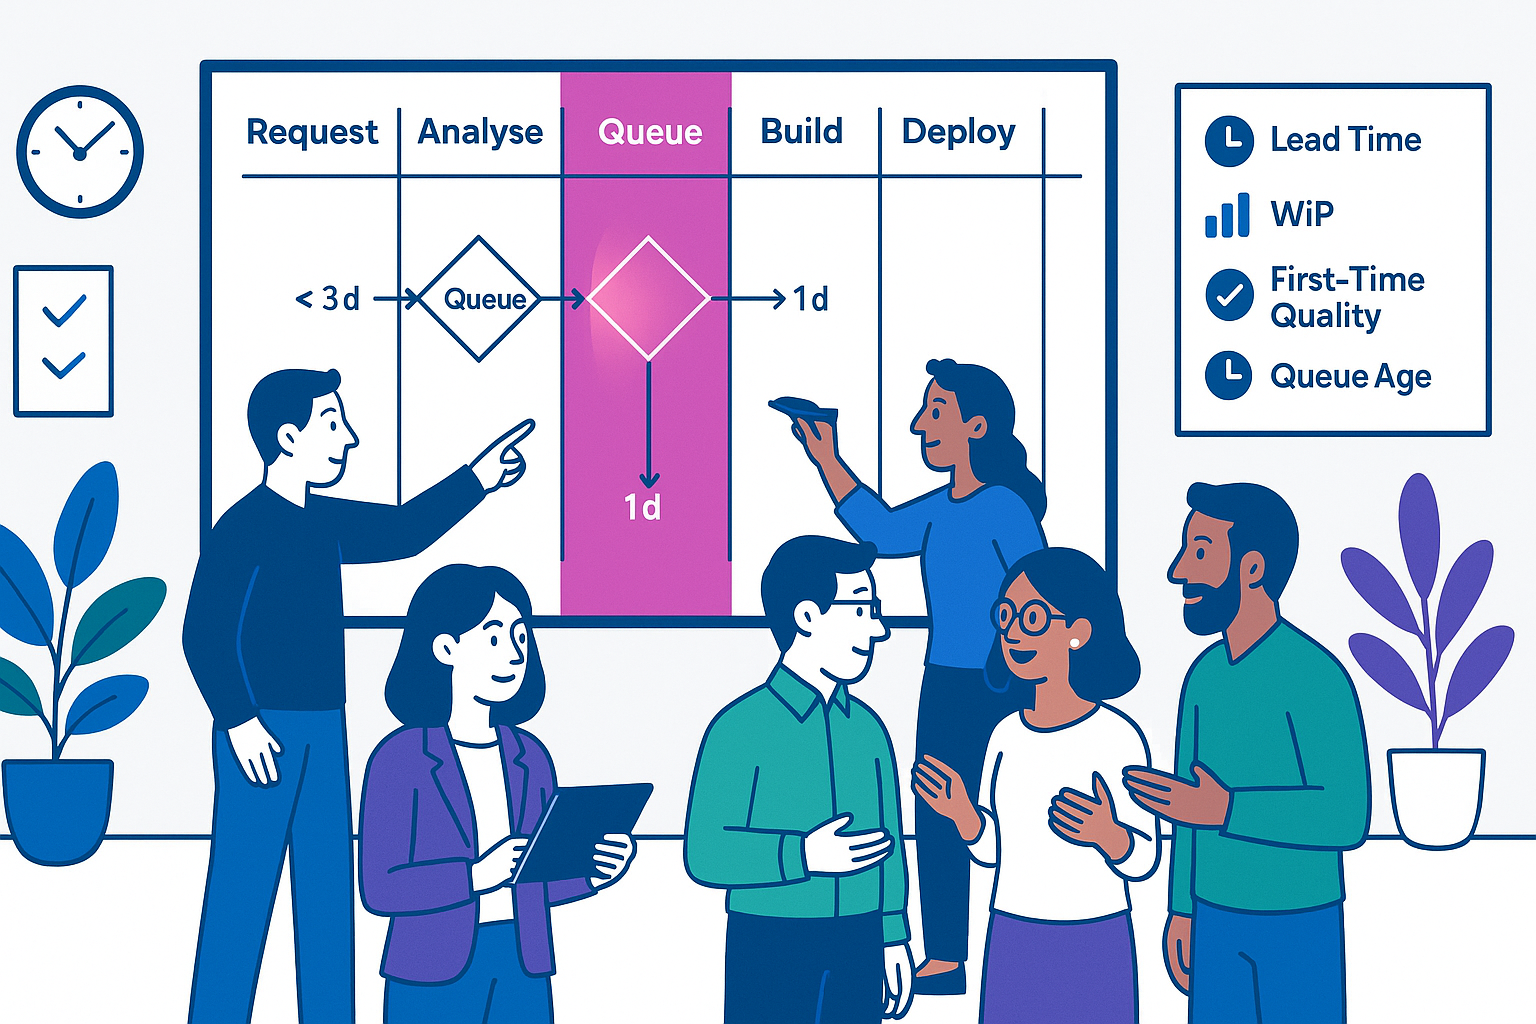
Done well, a flow map shows:
- Triggers that start work and the exact outcome that ends it.
- Every step where work is transformed, transferred, checked, or queued.
- Who owns each step, who decides, and where handoffs occur.
- How long each step takes, and how long work waits.
- Where defects and rework happen, and why.
- How the work connects to strategy, governance and the operating system you actually run, not the one on the wall.
At PerformanceNinja we frame this in the 6Ps. Purpose, People, and Proposition set Mission Readiness. Process, Productivity, and Potential deliver Mission Execution. Mapping the flow sits at the junction of Process and Productivity. It translates intent into outcomes at speed, through clear workflows and decision rhythms that people can trust. That shift is the difference between one-off wins and a repeatable operating system that scales .
The brutal truth leaders must face
- Invisible waiting time that dwarfs actual work time. Waiting is a core form of waste, along with rework, overprocessing, and unnecessary motion. These are not manufacturing ideas. They are the everyday killers of knowledge work too .
- Handoffs without ownership. Linkages that are not mapped create friction. Friction becomes leader escalation and churn. Clarity on handoffs, decision rights, and meeting rhythms is non-negotiable .
- An operating system by accident. Every organisation has an operating system. If you have not designed yours, you are living with drift. Decision protocols, workflows, performance metrics, and feedback loops must be explicit, simple, and inspected weekly .
- A team of teams that does not behave like one. Shared consciousness plus empowered execution beats centralised control in complex work. If you do not connect teams through outcomes and intent, you will drown in dependencies and status meetings .
What does good look like?
When work flows, you see fewer meetings, faster cycle times, cleaner handoffs, and a drop in rework. You see OKRs that guide, not distract, because teams can link their work to outcomes in real time. You see a consistent cadence of Looking Up, Looking Back, and Looking Forward that keeps everyone aligned without micromanagement .
How to map the flow of work: the leader’s playbook
This is not a theory exercise. Get in the room, map it, and measure it. Then fix the right thing.
1) Pick the flow and define the unit of value
Choose one critical value stream. For example: “From qualified opportunity to cash collected” or “From user insight to live feature adoption.” Define the flow unit. Is it a sales opportunity, a customer incident, a feature, a claim, or a document? Name the start trigger and the end outcome in one sentence. Tie the outcome back to strategy so you focus on what matters, not what is loud. Use OKRs to anchor the why, and make them visible in the session .
2) Put the right people in the room
You need one cross-functional group that owns the flow, not a parade of siloed meetings. Include step owners, decision makers, and the people who feel the pain. This is your team of teams for the session. The goal is shared consciousness and a single picture of reality .
3) Map the current state in 90 minutes
On a wall or digital canvas, capture the journey as the user experiences it, and as the work actually happens. Use swimlanes by role or function. For each step write:
- Name the step as a verb-noun (“Validate need,” “Draft proposal,” “Sign off,” “Deploy to prod”).
- Owner (R), Accountable decision-maker (A), those Consulted (C), and Informed (I). Keep this tight. Map decision rights explicitly to kill ambiguity .
- Input artefacts required. Output artefacts produced. State the Definition of Done.
- Handoffs. Draw linkages visibly. Do not hide the ugly paths. Linkages are how work really moves .
Use a Customer Journey Map to keep the end user perspective front and centre. If the customer journey and the internal process map do not line up, that disconnect is likely your biggest constraint. Capture Time-to-Value milestones so you see where the user feels progress, not just where you complete tasks .
4) Measure what actually happens
Do not accept folklore. For each step add hard numbers:
- Touch time: how long the step takes when worked on.
- Wait time: how long work waits in queue before the step.
- First-time quality: percentage complete and accurate to proceed without rework.
- Rework ratio: how much of the flow loops back and why.
- Queue age: how old the oldest item in the queue is.
- WIP count: how many items are in progress at each stage.
If you cannot pull these numbers easily, it confirms the problem. Start logging them in the tools you already use. Then publish a simple dashboard. Data must move beyond descriptive to diagnostic and predictive, or you will keep treating symptoms .
5) Name the waste and constraints with surgical honesty
Call out where the eight wastes show up today, especially waiting, extra-processing, rework, and motion. List the top three constraints that throttle throughput. Constraints are often decisions, handoffs, or missing inputs, not a lack of effort. Put a price on each constraint in hours and pounds. Prioritise ruthlessly. If everything is priority one, nothing is .
6) Redesign the work for flow, not theatre
Your aim is fewer handoffs, clearer decision rights, and shorter queues. Tactics that work:
- Collapse steps that only exist because of unclear boundaries. Map your Goals, Boundaries, and Linkages to restore coherence and speed .
- Assign one accountable owner for each deliverable. Convert vague tasks into explicit outputs. Publish Leader’s Intent for key items to reduce decision latency and escalation .
- Set WIP limits at the bottleneck and upstream. Protect focus. Limit starts. Finish more.
- Move checks to the point of work. Build quality in. Stop sending items on a tour of inspection departments.
- Remove batch thinking. Smaller, more frequent deliveries reveal problems faster and reduce rework.
- Eliminate status meetings by replacing them with one page of visible, current data and a short Quick Sync that ends with clear commit statements .
7) Make linkages explicit and visible
Across teams, most pain sits between the boxes, not in them. Map the explicit interfaces: handoffs, meeting rhythms, shared resources, and joint delivery points. Publish the RAPID or RASCI for every recurring interface so no one argues later about who decides what, and who is executing or informing whom .
8) Instrument your operating system
Lock changes into your operating system so they survive calendar churn. Define the cadence for review and improvement, the way decisions are made and communicated, and the performance metrics you will track. Write these into your Organisation Operating System alongside workflows and communication channels. Simplicity beats completeness. Fewer, better rules win .
9) Create a weekly rhythm to keep flow visible
Adopt a two-tier rhythm. Strategic reviews monthly. Tactical Quick Syncs weekly. Everyone sees the same board. Everyone ends meetings with commit statements. Tie the rhythm to your OKRs so you prune work that does not move the needles. A simple, shared cadence stops alignment drift without heavy bureaucracy .
10) Fix, learn, repeat
Run blameless debriefs on both successes and misses. Capture one learning per cycle. Publish it. Flow mapping is not a one-off. It is the backbone of continuous improvement. When issues rise, they rise to the point of clarity. If there is no clarity, they rise to you. Fix the clarity problem first, not the people .
What great looks like in 60 days
- Lead time down 25 to 50 percent in the mapped stream because waiting time is tackled head on.
- First-time quality up because checks move left and ownership is clarified.
- Fewer meetings and escalations because decision rights and linkages are now explicit.
- Less leader overwhelm because the operating system carries the load every week, not heroics .
Flow metrics that actually matter
You do not need 40 KPIs. Use a handful that tell the truth about flow:
- Lead time: request to done. Measured at the customer boundary.
- Flow efficiency: touch time divided by total time. Aim to raise it by removing waits.
- WIP: how many items are in progress. Control it where the bottleneck lives.
- First-time quality: percentage complete and accurate to proceed.
- Rework ratio: how many items loop back and why. Kill root causes.
- Queue age: the age of the oldest item. Old age is system rot.
Make these numbers visible where teams meet. Treat them as a shared language, not a performance cudgel. Metrics live inside your operating system, next to the decision and feedback loops that shape behaviour .
Rhythms that keep flow visible and aligned
- Strategic: Monthly review of OKRs, constraints, and resourcing. Prune work that does not move KRs. Reconfirm the Leader’s Intent for the next cycle .
- Tactical: Weekly Quick Sync. Review the flow board, blockers, and queue age. Decide. End with commit statements. No status theatre.
- Improvement: Fortnightly change tests on one constraint. Document what you tried, what you learned, and what sticks.
Common failure modes and how to avoid them
- Mapping theatre. Beautiful diagrams, zero measurement. Fix: always add numbers to steps. No numbers, no map.
- Tool worship. New software without new linkages. Fix: design the operating system first. Tools serve the cadence and decisions, not the other way round .
- Handoffs without decision rights. Fix: publish RASCI or RAPID for every recurring interface, with named owners .
- Endless pilots. Fix: run one 2-week experiment per constraint, instrument, and adopt if it works. No zombies.
- Ignoring the user. Fix: map the user journey and Time-to-Value alongside your internal flow. If they diverge, fix the divergence first .
- “We tried this before.” Fix: use the change equation in the room. Make the dissatisfaction, the vision, and the first steps concrete and bigger than the resistance. Then move. Momentum is a leadership decision .
Brief implementation plan
- Weeks 1 to 2: Pick one value stream. Map current state and capture baseline metrics. Publish decision rights for key interfaces. Remove the single worst queue.
- Weeks 3 to 6: Redesign for flow. Collapse steps, move checks left, set WIP limits at the bottleneck. Install weekly Quick Syncs with commit statements and a visible flow board.
- Weeks 7 to 10: Instrument the operating system. Stabilise the cadence. Run two improvement cycles on the next constraints. Add the second value stream.
- Weeks 11 to 12: Review outcomes. Prune work that does not move OKRs. Bank the wins. Repeat.
The big picture: design your operating system on purpose
This is bigger than process. It is system design. You are shifting from activity management to outcome management, from centralised control to empowered execution, from meetings about work to doing work with clarity. That shift is the hallmark of leaders who build resilient, adaptive, high-trust organisations in complex environments. Design and document your operating system. Define decision protocols, workflows, performance metrics, and feedback loops. Then run them. Every week. That is how Process and Productivity turn Purpose into results, again and again .
One last challenge
If I asked you, right now, to sketch the flow of your top value stream on a whiteboard, could you do it without phoning a manager or opening a ticketing tool? If not, start today. Pull your team of teams into a room. Map the work. Put numbers on it. Fix the first constraint. Then keep going. Leaders who master flow win. Everyone else hopes.
Next Steps
Want to learn more? Check out these articles:
Stop Alignment Drift: Cross-Team Clarity, Rhythm, Ownership
Decision Rigour: Make Fewer, Faster, Better Calls That Stick
Balance Authority and Autonomy: A Blueprint for Speed and Trust
To find out how PerformanceNinja could help you, book a free strategy call or take a look at our Performance Intelligence Leadership Development Programme.