
Clear Interfaces Between Teams: Build Speed, Cut Waste
What is a team interface?
If your teams are smart but work feels slow, it is not a talent problem. It is an interface problem. The friction is not in the people, it is in the joins between them. Work gets stuck in the gaps. Decisions drift. Accountability blurs. Everyone works hard while progress crawls. That is what unclear interfaces do.
Here is the blunt truth. As organisations scale, collaboration becomes a system problem. You can add stand-ups, hire a Chief of Something, or buy another tool. None of that fixes the joins. Only clear, designed interfaces between teams do.
This is your playbook to build them. No jargon. No fluff. Just a practical way to move faster with fewer surprises.
What is a team interface?
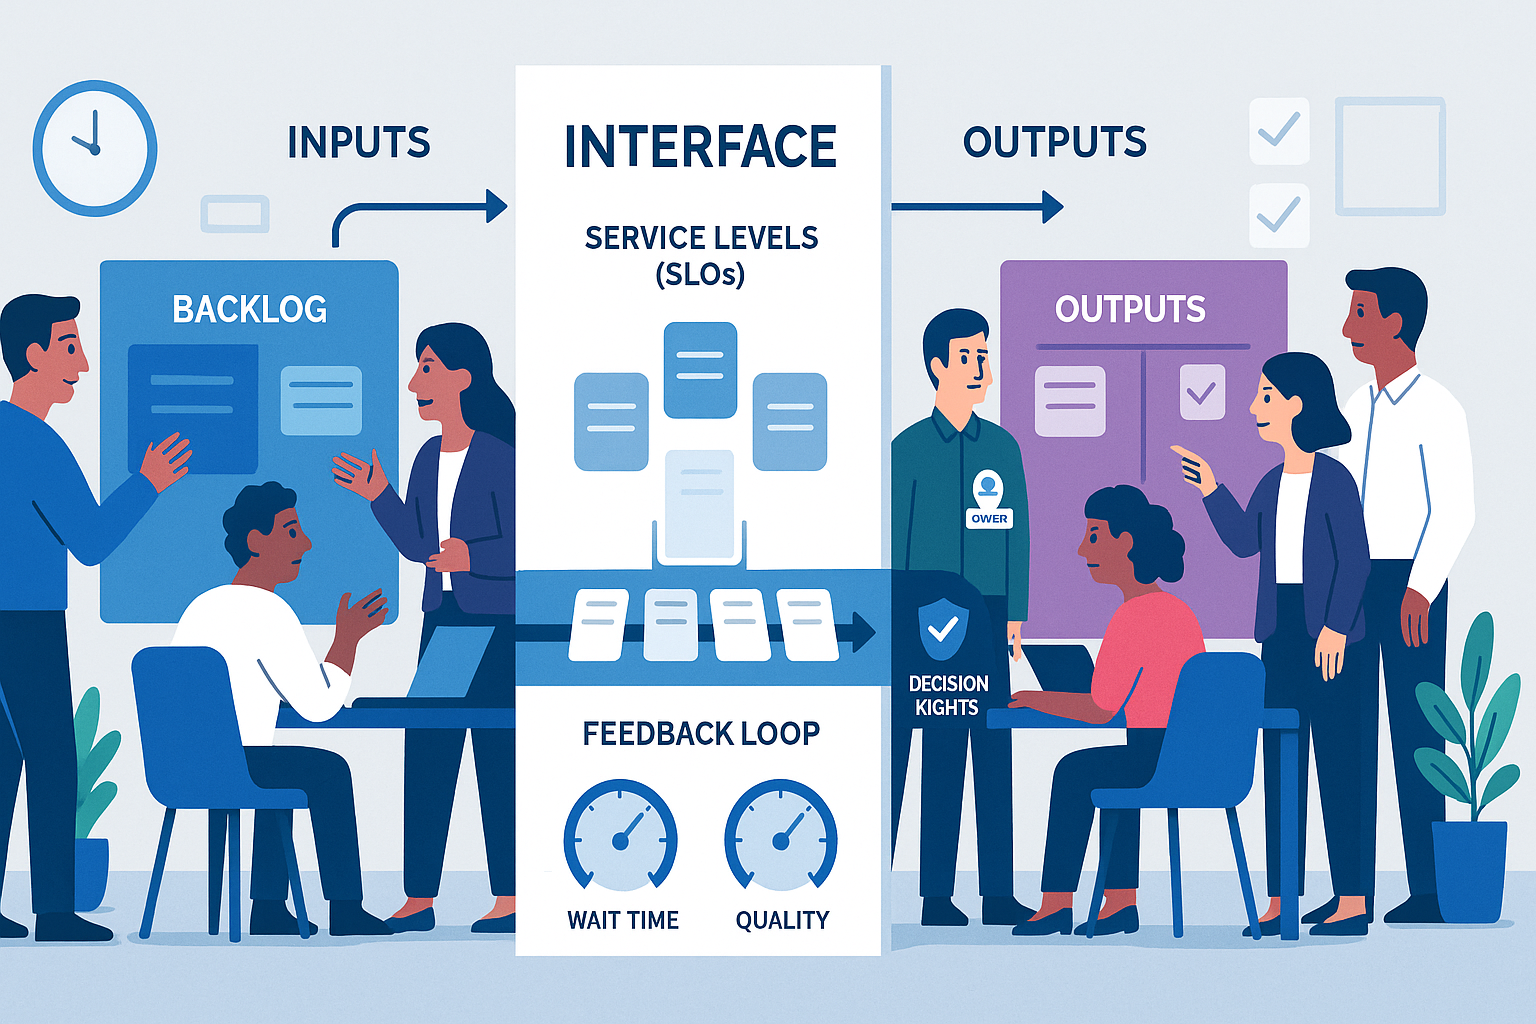
A team interface is the explicit contract for how two teams work together. It defines what value is exchanged, how it flows, and the rules of engagement. Think of it as a service contract you can point to, not a vibe or a hope.
It answers seven concrete questions:
- Why do these two teams interact at all and what outcome is expected?
- What services are provided and how are they requested?
- What does good output look like and how is it verified?
- What inputs are required and in what format?
- What are the service levels, response times and standards?
- Who decides what, with what authority, on what timescale?
- How do we handle change, exceptions and escalation?
This is not a job description. Not a RACI chart. Not a generic operating model slide. It is the day-to-day contract that removes ambiguity so the work can flow.
The cost of fuzzy interfaces
You already know the symptoms. You may have normalised them. Stop. They are not normal. They are the tax you pay for fuzzy interfaces.
- Endless clarifications because inputs are incomplete or in the wrong format.
- Slipped deadlines caused by hidden dependencies and contested priorities.
- Rework because teams disagree on what “done” means.
- Last-minute escalations because decision rights are unclear.
- Conflicts over capacity because demand is unmanaged and invisible.
- Surprise risks because compliance and security are bolted on at the end.
- Slackfire instead of a system. Everything routed through a few heroic individuals.
Fuzzy interfaces generate bureaucracy or chaos. Usually both. Clear interfaces generate speed without theatre.
Principles of top-tier interfaces
These principles will keep you honest. Apply them ruthlessly.
- Service over relationship. Relationships matter, but services move value. Define services first, then nurture the relationship.
- One owner per interface. Not a committee. A named person accountable for the health of that interface.
- Standard where you can, customise where you must. Use a common format and cadence. Allow local rules only when they drive outcomes.
- Version and publish. Treat interfaces like products. Version changes, keep a public page, and retire old rules with intent.
- Measure the joins. If you cannot measure wait time, quality and throughput between teams, you are flying blind.
- Bias to clarity, not completeness. Start simple and evolve. A 70 percent clear interface beats a 100 percent vague one.
- Default to self-service. Reduce tickets and triage by making the request protocols and templates obvious and easy.
The Interface Canvas: one page to rule the joins
You do not need a 50-page process manual. You need one page that everyone understands. Use this Interface Canvas to define how two teams work together. Keep it visible, versioned and current.
- Parties and scope. Which two teams, and which value stream or product area does this cover?
- Objective and value. What business outcome does this interface enable? State it in plain language.
- Services provided. List each service with a short description and owner. Example: Feature intake, data request, campaign build, test environment provisioning.
- Request protocol. How to ask for each service, with the required information, form or template. Provide a link.
- Inputs required. The minimum viable brief. Provide checklists for quality gates.
- Definition of done. The acceptance criteria for each service, including artefacts, quality checks and sign-off.
- Service levels. Response times, throughput targets and quality targets. Distinguish urgent vs standard.
- Decision rights. Who decides what, with what authority, and on what timescale. Include tie-break rules.
- Cadence and forums. The routines that keep the interface healthy. Weekly sync, monthly demand review, quarterly roadmap alignment.
- Artefacts and systems. Where everything lives. Backlog board, request queue, dashboards, documentation links.
- Dependencies and constraints. Upstream and downstream realities that matter. Capacity limits, cut-off dates, regulatory windows.
- Change and exceptions. How to request changes to scope or SLOs, and how to handle exceptions.
- Escalation path. A simple path with names and response times. No more than two hops.
- Metrics. The scoreboard for the interface. Wait time, rework rate, handoff defects, on-time delivery, internal NPS.
- Version and date. Who last updated it and when. Link to previous version for traceability.
Print it. Share it. Use it. If your teams cannot find this canvas in two clicks, you do not have an interface.
Where interfaces sit in the big picture
Use the PerformanceNinja 6Ps to place interfaces in context:
- Purpose. Interfaces align cross-team work to the organisation’s why and outcomes. They make strategy operational.
- People. Interfaces define behaviours, handoffs and decision rights, reducing interpersonal friction and performance ambiguity.
- Proposition. Interfaces connect product strategy to delivery, so value reaches customers without drama.
- Process. Interfaces are the joins in your operating model. They create flow across functions.
- Productivity. Interfaces set the rules for prioritisation, WIP limits and performance dashboards across teams.
- Potential. Interfaces protect innovation by creating safe pathways for experiments without derailing the core.
Get the interfaces right and most other problems shrink. Get them wrong and everything looks like a people problem.
A 30-day rollout plan that actually works
You do not need a reorganisation. You need rigour. Use this plan to go from fuzzy to clear in one month.
Week 1. Map and choose.
- Define the value streams. How does value actually flow to customers today?
- Surface friction. Ask leaders and doers to name the top five painful handoffs.
- Select the critical interfaces. Choose the three to five interfaces that create most delay or risk.
- Appoint owners. Name one accountable person per interface.
Week 2. Design and test.
- Draft the Interface Canvas for each chosen interface.
- Run joint working sessions with the two teams. Pressure-test definitions of done and inputs.
- Define SLOs. Agree realistic response times and throughput targets. Start with today’s data, not optimism.
- Dry run the request protocols using real, recent work.
Week 3. Pilot in the wild.
- Apply the interface on live work. One week. No exceptions.
- Hold a short daily check-in between interface owners for course corrections.
- Capture metrics. Wait time, rework rate, blocked items, on-time completion.
Week 4. Operationalise.
- Publish the canvases and make them easy to find.
- Lock the cadence. Weekly sync with a tight agenda. Monthly demand review and capacity planning.
- Add the metrics to shared dashboards. Review them in leadership forums.
- Version 1.1. Apply what you learned in the pilot and update the canvases.
The weekly interface sync: a compact agenda
Keep it short and useful. Ninety minutes is indulgent. Thirty minutes is discipline.
- Review pipeline. What is in flight and due in the next two weeks?
- Unblock. What is stuck? Who is accountable to remove the block by when?
- Demand forecast. What is coming next and what can be deferred?
- Changes. Any requested changes to scope, SLOs or dependencies?
- Metrics snapshot. Wait time, defects, rework. Only discuss trends and outliers.
- Improvements. One small change to test before the next sync.
Everything else can live in documentation or asynchronous updates.
Metrics that matter at the joins
Measure the friction so you can manage it. Keep the list tight and comparable across interfaces.
- Wait time at the interface. Average time from request submission to work start. Goal is a stable, predictable baseline with deliberate exceptions.
- Handoff defects. Percentage of requests returned due to missing or wrong inputs. Goal is downward trend through better templates and training.
- Rework rate. Percentage of outputs that fail acceptance criteria. Goal is single-digit, with a clear cause analysis for spikes.
- On-time delivery. Percentage of services delivered by their agreed date. Goal is high and honest, not 100 percent theatre.
- Escalation frequency. Number of escalations per period. Goal is low, with speed of resolution tracked.
- Internal NPS. How the receiving team rates the interface each month. Goal is high and improving.
- Throughput per capacity unit. Services delivered per available person-day. Goal is increasing with stability.
Publish these where everyone can see them. Review monthly. Tie improvements to the data.
Three quick case sketches
Product and Engineering. Feature intake is noisy. Everything is urgent. Engineering starts work with vague briefs and pays the price in rework. The interface canvas defines a two-tier intake service with a tight brief template, response times for triage, and a shared definition of done that includes design artefacts and test criteria. Within a quarter, wait time stabilises and rework drops because good begins upstream.
Marketing and Sales. Campaign build requests arrive half-baked. Sales complains about lead quality. The interface introduces a service catalogue with two request types, standard and high-impact, each with precise inputs, target audiences, and data requirements. Decision rights shift lead grading to a shared rule-set. The weekly sync examines conversion by campaign. Blame drops, conversion rises.
Platform and Feature Teams. Environments are inconsistent. Releases stall. The interface defines environment provisioning as a service with self-serve templates, SLOs for turnaround, and a change protocol for breaking updates. Decision rights make the platform team the authority on tooling. Feature teams get predictable environments and stop reinventing infrastructure.
Anti-patterns to kill fast
These patterns look helpful. They are not. Remove them.
- Slack as the system. If the process is a chat thread, you do not have a process. Use channels to support the interface, not replace it.
- Hero routing. One influential person acts as the router. It feels fast, then becomes a bottleneck. Replace with a published protocol.
- RACI mania. Over-specifying roles without defining the services and the work product. Start with services, then define decisions.
- Tool worship. A tool is not a system. It is a container for a system. Fix the interface, then configure the tool.
- Hidden queues. Work arrives in backchannels. Publish the request queue and enforce it.
- Vague “done”. If acceptance criteria are subjective, you are negotiating at the finish line.
- Four meetings where one would do. Overlapping forums destroy focus. Collapse into one weekly interface sync with a clear agenda.
Edge cases leaders miss
Cross-cutting teams. Security, compliance and data governance must have explicit interfaces that begin early in the value stream. Define their services as advisory and gating, with clear thresholds for each.
Multi-party interfaces. When three or more teams collaborate, create a primary interface owner and treat it like a product. Publish a joint canvas, not three bilateral ones.
External vendors. Apply the same interface canvas to vendors. If they refuse common metrics and change protocols, expect delay and cost.
Mergers and acquisitions. Map the top five cross-organisation interfaces in the first thirty days. Fast alignment here prevents months of confusion.
Remote and hybrid. Interfaces matter more when you cannot shout across a desk. Write things down. Tighten SLOs. Reduce reliance on “who you know”.
Tools that make interfaces real
Avoid over-engineering. Use simple artefacts that are hard to ignore and easy to maintain.
- Service catalogue. A living list of services each team provides, with links to request templates and SLOs.
- Request templates. Standard briefs with examples of good and bad inputs.
- Backlog and queue. A shared board that shows demand, WIP and ageing. No secret work.
- Dashboards. Four or five interface metrics, visible to both teams and leadership.
- RFC light. A short change request format for altering scope, SLOs or dependencies.
- Decision log. A simple log of decisions with date, owner and rationale. Stops re-litigating the past.
The leader’s job: set the rules for the joins
Leaders either enable flow or create fog. Your job is to set clarity at the joins and keep it. Do these things and do not delegate them away.
- Mandate interface canvases for the top five joins in your value stream.
- Name the owners and give them authority to say no to vague work.
- Make interface metrics part of leadership reviews and performance expectations.
- Tie incentives to outcomes, not activity. Reward reduced wait time and rework.
- Protect the cadence. Cancel other meetings before you cancel the interface sync.
- Bake interfaces into onboarding. New managers inherit clear contracts, not institutional folklore.
Frequently asked questions, answered straight
Isn’t this just process? No. Process is what a team does internally. An interface is how teams connect. You need both.
Won’t this slow us down? It will feel slower for two weeks while you get specific. Then it becomes much faster because rework disappears and decisions are made once.
What if we already have SLAs? Good. Now connect them to decision rights, request protocols and definitions of done. SLAs without clarity are theatre.
Do we need to redesign the organisation? Not to start. Interfaces often fix performance without structural change. If you do redesign later, your interfaces will survive it.
Final word: fix one join this week
Do not attempt a company-wide transformation. Pick one painful interface and fix it in forty-eight hours. Publish a one-page canvas. Run the weekly sync. Measure wait time, rework and handoff defects. Improve weekly for a month.
Speed is built at the joins. Clarity is a leader’s job. Start now.
Next Steps
Want to learn more? Check out these articles:
Operating Model Clarity: Turn Strategy Into Results Quickly
Reduce Bureaucracy While Scaling: Leader’s Guide to Speed
Align Goals to Weekly Work: Build an Execution Rhythm
To find out how PerformanceNinja could help you, book a free strategy call or take a look at our Performance Intelligence Leadership Development Programme.