
Leading Indicators for Team Performance: Build Yours Fast
Your lag metrics are lying to you
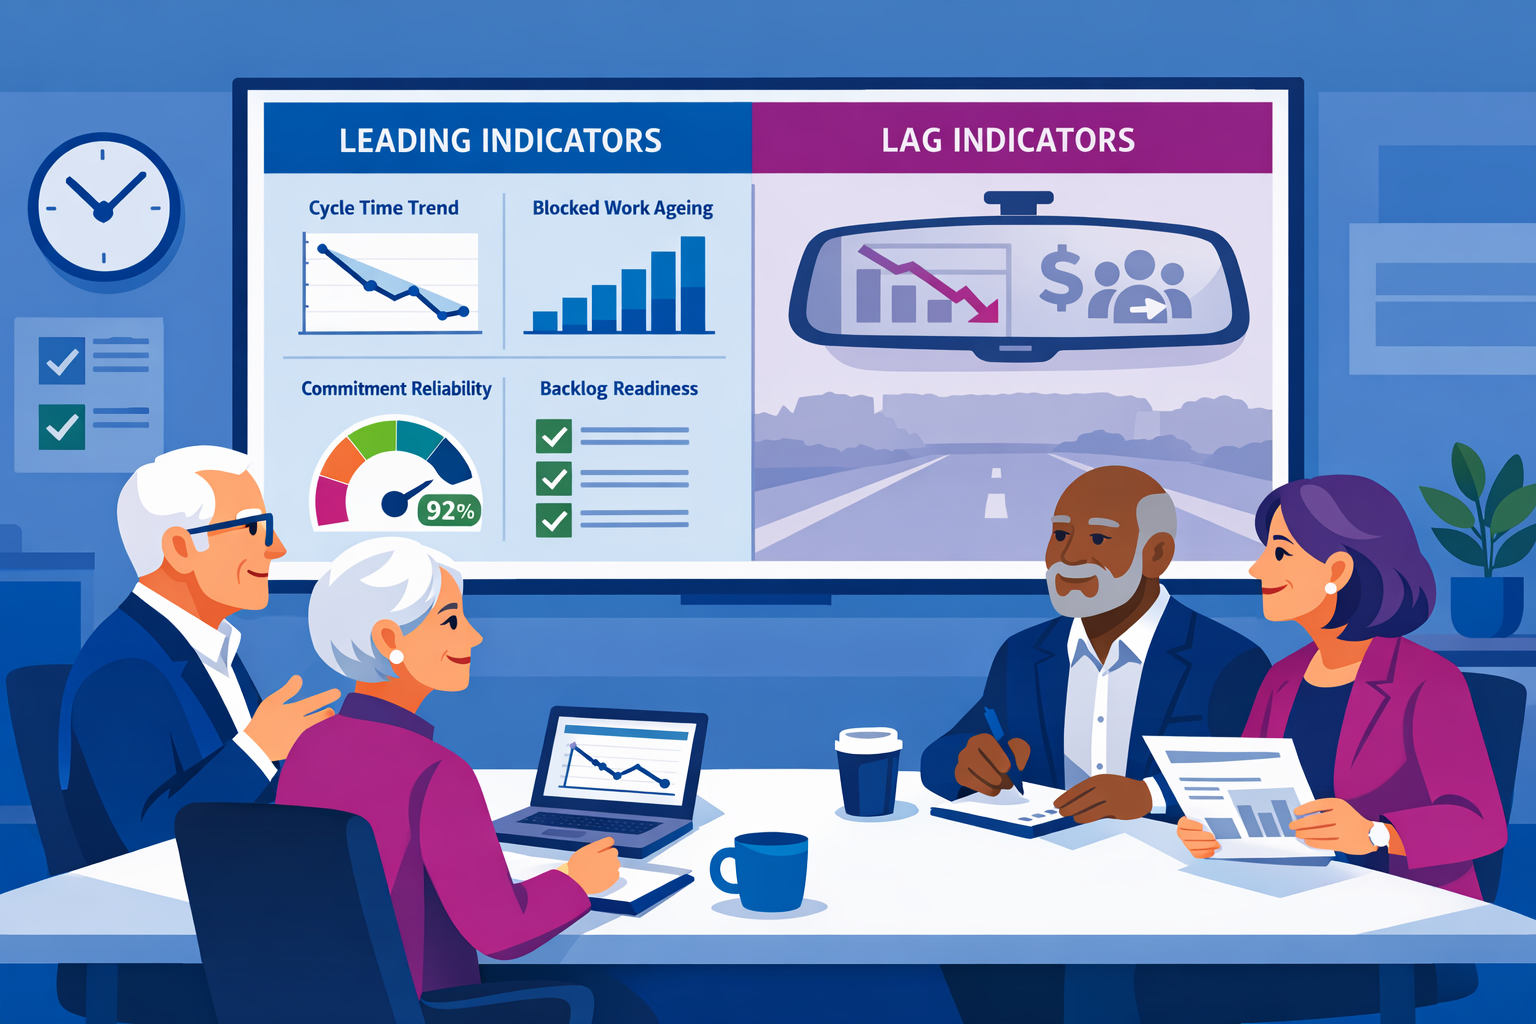
Most leadership teams run their business through the rear-view mirror.
Revenue. Delivery dates. Customer churn. Defect rates. Engagement surveys. All useful, all too late.
By the time your “performance” metrics move, the causes have already happened. The decisions were made (or avoided). The work was started badly. The customer experience was already damaged. The good people already started scanning LinkedIn.
That is what lag indicators do. They report history.
Leading indicators do something far more valuable. They tell you whether the team is on track before it is too late to correct.
If you are serious about performance, you need to stop worshipping outcomes and start managing the inputs that create them.
This article shows you exactly how to create leading indicators for team performance, without building a bloated dashboard nobody trusts.
Leading vs lagging: the distinction leaders keep missing
Here is the clean, practical definition.
Lag indicators measure results after the work has played out. They are hard to influence quickly.
Leading indicators measure behaviours, process health, and throughput signals that predict results. They are influenceable weekly, sometimes daily.
A lag indicator answers: “How did we do?”
A leading indicator answers: “Are we likely to do well, and what should we change this week?”
Examples that make the difference obvious
Sales:
Lag: monthly revenue, win rate, pipeline value.
Lead: qualified discovery calls completed, proposals sent within 48 hours, decision-maker attendance rate.
Delivery:
Lag: on-time delivery, escaped defects, rework cost.
Lead: backlog readiness, cycle time trend, blocked-work ageing, WIP per person.
Customer success:
Lag: churn, expansion, NPS.
Lead: time-to-first-value, adoption of key features, health score movements, executive sponsor touchpoints.
If you cannot influence it in the next 7 to 14 days, it is probably not a leading indicator. It might still matter, but it will not help you steer.
The brutal truth: most “leading indicators” are fake
Leaders love the idea of leading indicators. They just do not do the hard part.
They pick measures because they are easy to count, not because they predict performance.
They create dashboards full of noise.
They obsess over activity, then act surprised when activity does not translate into outcomes.
Common failure modes:
Activity theatre: counting meetings, emails, tickets created, training hours. Busy is not productive.
Vanity signals: “% of tasks updated”, “story points completed”, “calls made”. They can be gamed.
Too many measures: 30 metrics and no decisions. Measurement becomes performance cosplay.
No operational definition: each manager interprets the metric differently, so your trend is fiction.
No link to strategy: teams optimise the metric, while the business bleeds elsewhere.
Your leading indicators must be predictive, influenceable, and decision-driving. Otherwise, do not bother.
A simple way to design leading indicators that work
Use this design sequence. It is fast, it is concrete, and it forces you to connect measures to reality.
Step 1: Start with the performance promise
Pick one outcome that matters and state it like a promise.
Examples:
“We deliver client projects on time, with minimal rework.”
“We turn qualified opportunities into revenue within 60 days.”
“New customers reach first value within 14 days.”
If you cannot state the promise, you cannot measure performance.
Step 2: Identify the controllable drivers
Ask: “What must be true weekly for that promise to be true monthly?”
Force yourself into controllable drivers, not externalities.
For a delivery team, drivers might be:
Work is ready before it enters delivery.
Flow is stable, with low blocked time.
Quality is built in, not inspected at the end.
Dependencies are actively managed.
This is where most teams discover they do not have a “performance problem”. They have a design problem. Purpose, Process, People, and Productivity are misaligned. Your measures should make that visible, not hide it.
Step 3: Convert drivers into observable signals
A driver becomes a metric only when it is observable and defined.
Bad: “Improve backlog quality.”
Good: “% of next 2 weeks of work meeting Definition of Ready.”
Bad: “Reduce blockers.”
Good: “Average age of blocked items (days) and % of items blocked longer than 2 days.”
Bad: “Increase accountability.”
Good: “% of weekly commitments delivered as committed.”
The aim is not clever metrics. The aim is to make reality measurable.
Step 4: Make the indicator hard to game
If a metric can be gamed, assume it will be, even by good people under pressure.
Use one of these anti-gaming tactics:
Pair a quantity metric with a quality metric (e.g., “calls completed” plus “decision-maker attendance rate”).
Use time-based measures (cycle time, ageing, time-to-first-value) that are harder to fake at scale.
Measure outcomes of a step, not the step itself (e.g., “% of proposals receiving a next-step commitment” rather than “proposals sent”).
Sample audit a small number weekly (e.g., review 5 “Ready” items for compliance).
Good measurement design assumes normal human behaviour under stress. It does not rely on motivational posters.
Step 5: Set thresholds that trigger action
A metric without a trigger is trivia.
For each leading indicator, define:
Green: operating range, no action.
Amber: investigate cause this week.
Red: leadership intervention required, remove obstacles, change plan.
Example:
Blocked work ageing: Green 0 to 1 day, Amber 1 to 2 days, Red 2+ days.
Commitment reliability: Green 85%+, Amber 70% to 85%, Red below 70%.
Do not over-engineer the first thresholds. Start, learn, adjust.
Step 6: Assign an owner and a cadence
Metrics die when “everyone owns them”. Assign one accountable owner per indicator.
Also pick a cadence that matches how fast you can change the driver:
Daily: flow health, blockers, customer escalations.
Weekly: readiness, commitment reliability, pipeline progression.
Fortnightly or monthly: capability measures, system health, talent pipeline.
If you only look monthly, you have chosen lag management.
The 12 leading indicators most teams actually need
Every organisation is different, but the patterns repeat. Most senior leaders want visibility into whether teams are focused, flowing, and learning. These indicators cover that without drowning you.
1) Commitment reliability
What it predicts: delivery trust, planning accuracy, cross-team confidence.
Measure: % of weekly committed outcomes delivered by end of week.
Notes: define “committed outcomes”, not tasks. Outcomes are verifiable.
2) Work in progress (WIP) per person
What it predicts: context switching, cycle time, burnout risk.
Measure: average concurrent active items per contributor.
Trigger: if WIP rises, something is wrong with prioritisation or interruption control.
3) Cycle time trend
What it predicts: throughput, predictability, cost of delay.
Measure: median cycle time for the last 10 to 20 items.
Why median: average gets distorted by outliers.
4) Blocked work ageing
What it predicts: dependency health, decision latency, bureaucracy creep.
Measure: average age of blocked items, plus count of items blocked over 2 days.
Leadership use: this is where senior leaders can actually help by removing constraints.
5) Backlog readiness
What it predicts: churn, rework, missed deadlines.
Measure: % of the next 2 weeks of work meeting Definition of Ready.
Definition of Ready: acceptance criteria, dependencies identified, owner confirmed, capacity considered.
6) Rework ratio
What it predicts: hidden quality debt.
Measure: rework hours as a % of total delivery hours, weekly.
Warning: if rework is rising while output looks stable, you are borrowing from the future.
7) Decision turnaround time
What it predicts: speed, morale, accountability clarity.
Measure: median time from decision request to decision made for agreed decision types.
Senior leader reality: slow decisions are often a leadership design flaw, not a team flaw.
8) Meeting load vs maker time
What it predicts: deep work capacity and delivery pace.
Measure: hours in meetings per person per week, plus protected focus blocks scheduled.
Trigger: delivery teams drowning in meetings will miss deadlines regardless of talent.
9) Cross-team handoff quality
What it predicts: client experience, internal friction, delays.
Measure: % of handoffs accepted first time without clarification, sampled weekly.
How: review a small sample, do not create bureaucracy.
10) Customer signal velocity
What it predicts: churn, reputation, product-market fit erosion.
Measure: time from customer issue raised to meaningful response, plus recurring themes count.
Leadership use: recurring themes are strategy and proposition feedback, not just “support tickets”.
11) Capability investment rate
What it predicts: future capacity, quality, retention.
Measure: % of time spent on capability-building work (automation, documentation, training, refactoring), with clear intent.
Reality: if this goes to zero, you are consuming the organisation.
12) Talent risk pulse
What it predicts: unwanted attrition and performance drops.
Measure: monthly manager judgement score on top talent risk (Low, Medium, High) backed by evidence, plus internal mobility conversations completed.
Rule: no anonymous surveys as your only signal. Leaders must lead.
How to choose the right indicators for your team
You do not need all 12. You need the right 5 to 7 that reflect your current constraints.
Use this filter. Keep an indicator only if it passes.
The “SPEED” filter
Specific: unambiguous definition, consistent counting.
Predictive: a plausible causal link to your lag outcomes.
Executable: the team can influence it within 1 to 2 weeks.
Economical: low effort to collect, preferably from existing tools.
Directional: tells you what to do next, not just what happened.
If it fails the filter, it is dashboard decoration.
Connect leading indicators to the big picture (without drowning)
Leading indicators are not just “team metrics”. They are the operating system of the organisation.
If you use PerformanceNinja’s 6Ps as a sanity check, most broken indicator sets fail in predictable places:
Purpose: indicators do not tie to a clear performance promise.
People: you measure output without measuring capability and decision quality.
Proposition: you optimise internal efficiency while customers drift away.
Process: you measure results but ignore flow, quality, and handoffs.
Productivity: no clear commitments, no follow-up, no thresholds that trigger action.
Potential: zero indicators for innovation health, then you act surprised when the pipeline dries up.
You are not trying to build a measurement empire. You are trying to run a business with clarity.
A high-level implementation plan (30 days)
If you want this to work, do it fast, then iterate. Long metric design projects are just another way to avoid accountability.
Week 1: Pick the promise and the lag outcomes
Choose one performance promise per team.
Select 1 to 2 lag outcomes (e.g., on-time delivery, churn, revenue, defect rate).
Agree the review cadence and decision forum (weekly ops review is the default).
Week 2: Design 5 to 7 leading indicators
Map controllable drivers.
Convert to observable measures with clear definitions.
Add anti-gaming pairs where needed.
Assign owners and thresholds.
Week 3: Instrument and baseline
Pull data from existing systems (CRM, ticketing, project tools) where possible.
Run a two-week baseline with no judgment, just truth.
Remove any metric that creates heavy admin.
Week 4: Start managing with it
Run the first weekly review focused on actions, not explanations.
Make one process change based on the signals.
Decide what you will stop doing to protect focus and flow.
The win is not the dashboard. The win is better decisions, sooner.
What your weekly review should look like (and what to ban)
If you do not change how you lead, leading indicators will become another reporting burden.
Structure the weekly review like this:
Reality check (10 mins): which indicators are Red or Amber?
Root cause (15 mins): what changed in the system, not who is to blame?
Decisions (15 mins): what will we change this week, and who owns it?
Follow-up (5 mins): confirm next review and expected movement.
Ban these behaviours:
Blame-based interrogation
Status theatre and long storytelling
Debating the metric definitions in the meeting (fix definitions outside the meeting)
Adding new metrics every time something surprises you
Leading indicators are a tool for learning and control. Not punishment.
The standard objections (and the real answers)
“We are too busy to measure this.”
Then you are too busy to manage. Choose fewer indicators. Automate collection. Use sampling. But do not pretend ignorance is efficiency.
“Our work is complex, you cannot measure it.”
You cannot measure everything. You can measure enough to steer. Complexity is exactly why you need leading indicators, because complexity increases the cost of late discovery.
“People will game the metrics.”
Yes, if you design them badly or weaponise them. Use anti-gaming pairs, focus on system changes, and keep the set small and stable.
“We already have KPIs.”
Most KPI sets are lag heavy. Keep the KPIs, but add leading indicators that give you weekly control.
Final word: stop managing outcomes and start managing causes
If you are a senior leader, your job is not to hope for performance. Your job is to design for it.
Lag indicators tell you what happened.
Leading indicators tell you what is about to happen, and what you can still change.
Create 5 to 7 leading indicators that are predictive, influenceable, and hard to game. Review them weekly. Make decisions. Remove obstacles. Tighten the system.
That is how teams become reliable. That is how organisations scale without losing their edge.
Next Steps
Want to learn more? Check out these articles:
Team Accountability in Scale-Ups: Fix It Before It Breaks
Leadership Scorecards That Actually Improve Team Performance
Reduce Meeting Overload in Leadership Teams Without Losing Control
To find out how PerformanceNinja could help you, book a free strategy call or take a look at our Performance Intelligence Leadership Development Programme.