
Measuring Organisational Health Beyond Engagement Scores
Introduction
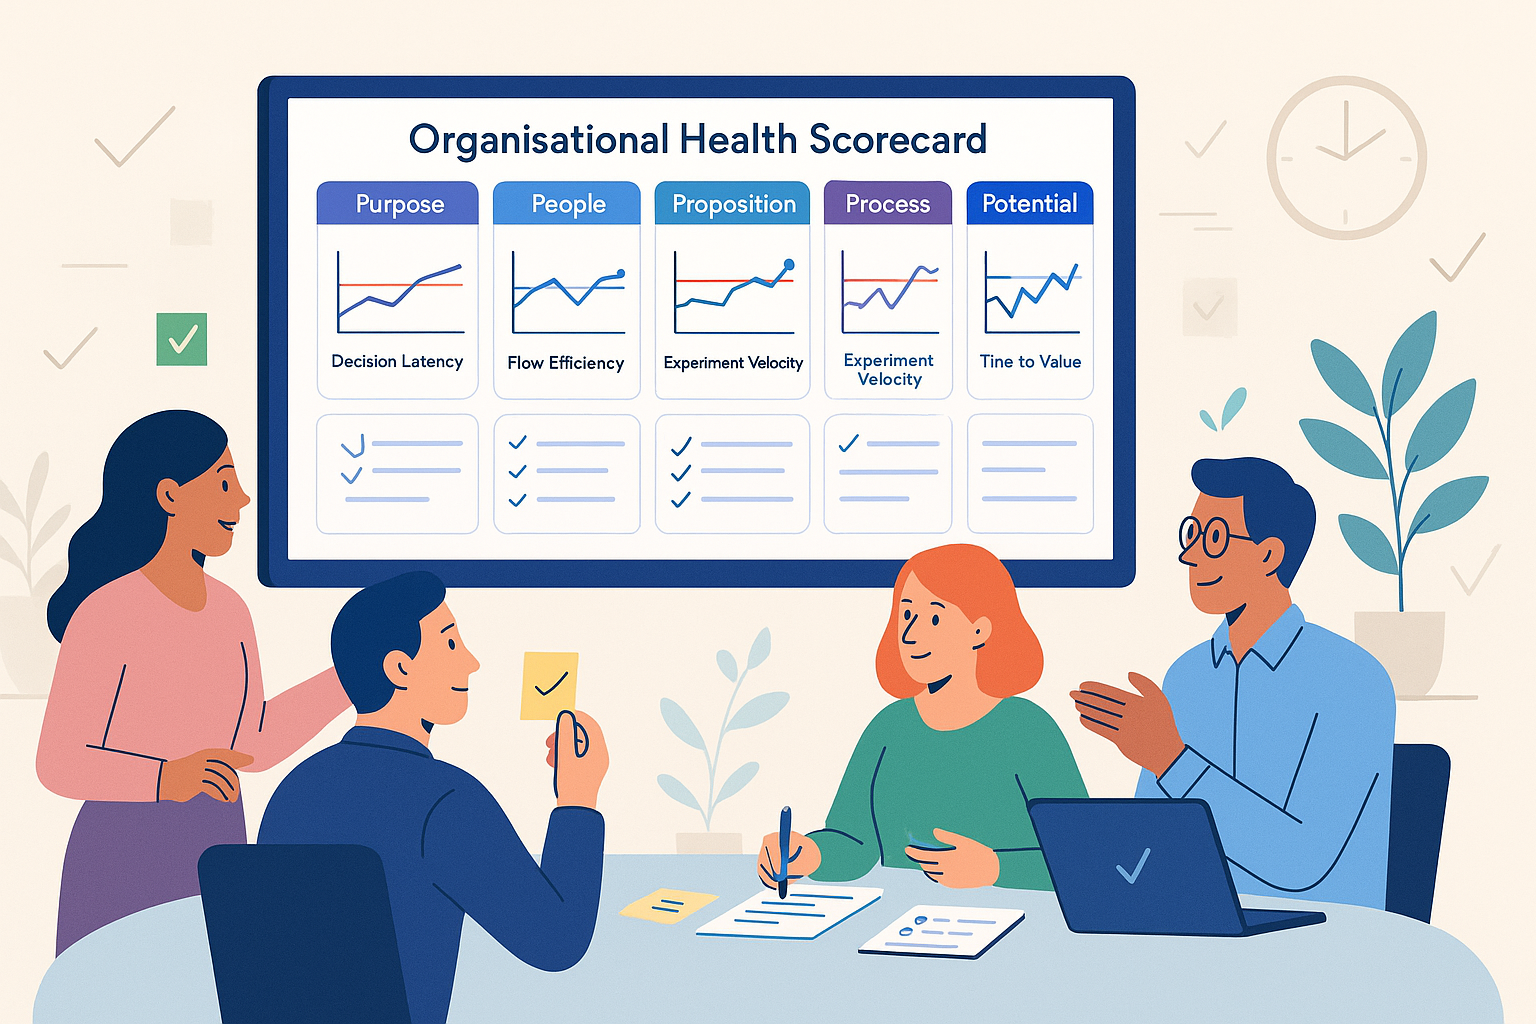
If engagement scores were a medical check-up, they’d be your pulse, not a full blood panel. Useful, yes. Sufficient, no. Too many leaders assume a high engagement number equals a healthy organisation. It doesn’t. You can have highly engaged people in a strategically confused, process-clogged, innovation-averse organisation. This guide gives you a rigorous, end-to-end method to measure organisational health beyond engagement, built around the six lenses of Purpose, People, Proposition, Process, Productivity and Potential. Expect specifics, operational definitions and a 30-day build plan.
The problem with engagement scores
Engagement measures sentiment, not system performance. It’s one input among many and is prone to bias, gaming and misinterpretation.
- What engagement actually measures: how people feel about work right now. It’s a lagging proxy for many upstream conditions and can be influenced by timing, novelty and communication campaigns.
- Common failure modes:
- Recency and halo effects from leadership announcements or bonuses
- Survivor bias when disengaged people have already left
- Question framing differences between surveys
- Gaming from managers timing “feel-good” actions near survey windows
- Misuse as a performance KPI rather than a diagnostic input
If you use engagement as your single truth, you will over-index on mood and under-index on capability, throughput and resilience.
A practical model for organisational health
Measure organisational health as the capacity of your system to consistently achieve outcomes under changing conditions. Use six lenses. For each, track both leading indicators (predictive) and lagging indicators (outcomes). Keep operational definitions tight and comparable over time.
Purpose: strategic clarity and alignment
What to measure
- Strategic Clarity Index: % of employees who can accurately state the 3 strategic priorities and success metrics
- Goal Cascade Quality: % of team objectives that map cleanly to company priorities with measurable outcomes
- Decision Principles Adoption: % of major decisions explicitly citing agreed principles or guardrails
- Customer Value Alignment: % of initiatives with a documented value hypothesis tied to target segments
Leading vs lagging
- Leading: clarity index, adoption of decision principles
- Lagging: % of projects achieving intended customer outcomes, strategy execution rate
Operational definitions
- “Accurately state”: correct priorities and metrics, verbatim or close, validated via random sampling interviews
People: capability, leadership and safety
What to measure
- Leadership Bench Strength: ratio of ready-now successors for top roles
- Capability Heatmap: skills coverage vs strategic needs by function
- Psychological Safety Index: frequency of constructive dissent in decision forums and retrospectives
- Regretted Attrition: 12-month rolling rate for top quartile performers
- Manager Effectiveness: upward feedback on coaching, clarity and follow-through
Leading vs lagging
- Leading: capability coverage, safety signals, manager behaviours
- Lagging: regretted attrition, internal mobility success rate
Operational definitions
- “Constructive dissent”: documented challenge during meetings, with rationale captured and response noted
Proposition: product-market value and economics
What to measure
- Win Rate by ICP: conversion for ideal customer profiles vs non-ICP
- Time-to-Value: median time from contract to first meaningful outcome for the customer
- Gross Margin Trend by product or service
- Retention and Expansion: net revenue retention by cohort
- Value Hypothesis Validation Rate: % of experiments confirming value assumptions
Leading vs lagging
- Leading: validation rate, time-to-value
- Lagging: gross margin, net revenue retention
Operational definitions
- “Meaningful outcome”: agreed, quantifiable customer KPI improvement within a time window
Process: flow, quality and reliability
What to measure
- Lead Time for Change: idea to live, across functions
- Flow Efficiency: active work time divided by total elapsed time
- Rework Ratio: % of work items reopened or redone post-completion
- Change Failure Rate and MTTR: for operational changes, incidents and releases
- Control vs Autonomy Index: policies removed or simplified without increasing risk incidents
Leading vs lagging
- Leading: flow efficiency, rework signals
- Lagging: incident rates, customer-reported defects
Operational definitions
- “Work item”: consistently defined across teams, with a common taxonomy
Productivity: throughput, focus and decision velocity
What to measure
- Throughput per FTE: completed value-adding work items per person per period, quality-adjusted
- Plan Accuracy: forecast vs actual completion for committed work
- WIP Discipline: % of teams adhering to agreed WIP limits
- Decision Latency: time from issue identification to irreversible decision
- Meeting Load Index: total hours in meetings per FTE, with decision yield per meeting
Leading vs lagging
- Leading: WIP discipline, decision latency
- Lagging: throughput per FTE, plan accuracy
Operational definitions
- “Value-adding work item”: linked to a measurable customer or business outcome, not internal busywork
Potential: innovation capacity and option value
What to measure
- Experiment Velocity: number of high-quality experiments per quarter with clear hypotheses and decisions
- R&D or Exploration Intensity: % of capacity allocated to future bets
- New Revenue Ratio: % of revenue from products launched in last 24 months
- Option Funnel Health: count and quality rating of validated opportunities in the pipeline
- Kill Rate: % of ideas decisively stopped by evidence at early gates
Leading vs lagging
- Leading: experiment velocity, exploration intensity, kill rate
- Lagging: new revenue ratio, ROI of bets
Operational definitions
- “High-quality experiment”: pre-registered hypothesis, success criteria, data plan and next action
Build your Organisational Health Scorecard in 30 days
You don’t need a year-long programme. You need discipline and speed.
- Define outcomes. Write 3 non-negotiable business outcomes for the next 12 months. Example: increase net revenue retention to 115%, reduce decision latency by 40%, cut time-to-value by 30%.
- Select metrics. Pick 2–3 metrics per lens that best predict those outcomes. No more than 18 in total.
- Set operational definitions. For each metric, define scope, data source, frequency, owner, calculation, and exclusion rules. Publish the dictionary.
- Baseline. Pull 12 months of history where possible. If absent, run a 2-week rapid measurement sprint to instrument the basics.
- Targets and guardrails. Set quarterly targets and guardrails. Example: Decision latency target 5 days, guardrail 10 days. Crossing a guardrail triggers a pre-defined action.
- Instrumentation. Connect systems to a minimal data pipeline. Do not over-engineer. Use existing tools and create a staging sheet if needed.
- Cadence. Weekly data refresh, monthly operating review, quarterly strategic review. Lock the calendar.
- Visualise. Build a single-page scorecard: six lenses, with trend lines, targets and guardrails. No traffic-light theatre. Show the data and the deltas.
- Governance. Assign an executive owner per lens. Define a triage protocol: if a metric breaches a guardrail, which forum decides what, by when.
- Run the first review. Focus on 3 deltas only. Agree actions, owners, and due dates. Log decisions and revisit outcomes next month.
Measurement hygiene: make the data credible
Avoid survey pollution
- Sample properly. Stratify by function, location and level. Avoid convenience samples.
- Minimise frequency bias. Don’t barrage people with surveys in high-stress periods.
- Guarantee anonymity and publish the rules. If trust is low, engage a neutral third party for collection.
Standardise operational definitions
- One dictionary. No metric exists without a definition, owner and calculation.
- Keep revisions explicit. Version-control definitions. Show when and why changes were made.
Prevent gaming
- Triangulate. Use least two sources per lens where possible.
- Use cost-of-manipulation as a design constraint. Make it easier to improve the work than to game the number.
- Audit quarterly. Randomly sample work items and recalculate metrics.
Track signal vs noise
- Use control charts for process metrics. Distinguish common cause from special cause variation.
- Adjust for seasonality. Mark known cyclical events on charts.
- Stop RAG theatre. Leaders should discuss run charts, deltas and causes, not colours.
Linking health to performance outcomes
Metrics exist to change performance, not to decorate dashboards. Create a simple causal chain that’s testable.
- Example chain 1: Improved Decision Principles Adoption and reduced Decision Latency lead to fewer context-switches and faster throughput, which lowers time-to-value and lifts net revenue retention.
- Example chain 2: Higher Capability Coverage and Psychological Safety increase experiment velocity and kill rate of weak ideas, which concentrates investment into higher-return bets and raises new revenue ratio.
Test the chain by staging interventions. Improve the leading indicator in one unit while holding others constant. Watch for predictable movement in lagging indicators with a reasonable time lag. If it doesn’t move, revisit the chain.
The cadence that sustains health
- Monthly Operating Review: led by COO or equivalent. Focus on Process and Productivity deltas, decision latency, WIP breaches, rework sources. Agree corrective actions.
- Quarterly Strategic Review: led by CEO. Revisit Purpose, Proposition and Potential. Validate assumptions, the option funnel, and reallocate resources. Tie to budget and headcount decisions.
- Biannual Deep Dive: cross-functional audit of definitions, data quality, and metric relevance. Prune dead metrics. Add at most two newcomers.
Roles
- ELT: owns the lens outcomes and trade-offs
- HR or People Ops: runs capability mapping, manager effectiveness and safety measurement
- PMO or Strategy: maintains the dictionary, the scorecard and review cadences
- Finance: aligns targets and guardrails to financial constraints and forecasts
Case vignettes
Vignette A: High engagement, poor delivery
A software scale-up maintained 85% engagement but missed 60% of quarterly delivery targets. The scorecard exposed extreme decision latency and broken WIP discipline. Actions: installed decision principles, introduced WIP limits, and created a weekly risk review. Results: decision latency cut by 55%, throughput per FTE up 28%, time-to-value down 35% in two quarters. Engagement stayed high, but outcomes finally matched it.
Vignette B: Strong revenue, cultural erosion
A services firm grew 30% year-on-year while regretted attrition spiked. The People lens showed low managerial follow-through and falling psychological safety. The Process lens flagged rising rework. Actions: manager coaching on clarity and follow-through, paired with post-incident learning reviews. Results: rework down 22%, regretted attrition halved, client NPS up 9 points. Health recovered before revenue took a hit.
Frequently abused metrics to drop or reframe
- eNPS as a leadership KPI: use it diagnostically, not as a target
- Utilisation: optimise flow efficiency and value delivery, not 100% busyness
- Time-in-seat: meaningless for knowledge work; measure outcomes and cycle times instead
- OKR completion rate: focus on value achieved and quality of key results, not checkbox completion
Early-warning signals that actually work
- Decision Latency spikes: signal strategic confusion or risk aversion
- Rework Ratio increases: signal poor requirements or quality gates
- Unplanned Work proportion rises: signal hidden failure demand or brittle processes
- Cost of Delay visibility drops: signal prioritisation drift
- Incident churn: repeatedly reopened incidents signal superficial fixes
- Experiment Velocity stalls: signal cultural fear or capability gaps
What good looks like
Maturity levels
- Ad hoc: siloed metrics, opinion-driven debates, constant surprises
- Integrated: shared dictionary, single scorecard, monthly reviews, fewer surprises
- Predictive: leading indicators reliably move outcomes, deliberate experiments validate the causal chain
- Self-correcting: teams anticipate issues, adjust proactively, and leaders focus on trade-offs not firefighting
Traits of a healthy organisation
- Clarity: people know priorities and decision principles
- Flow: work moves with minimal friction and low rework
- Focus: WIP limits enforced, meetings produce decisions, not updates
- Learning: experiments run routinely, bad ideas die quickly, wins scale fast
Start today: a 2-week starter kit
Week 1
- Day 1: Write the three outcomes you must deliver this year.
- Day 2: Map the six lenses to those outcomes. Select 12–18 metrics. Draft operational definitions.
- Day 3: Validate definitions with functional leaders. Reduce ambiguity.
- Day 4: Pull existing data. Identify gaps. Choose interim sources.
- Day 5: Build a single-page scorecard. Plot 12 months of history where available.
- Day 6: Set targets and guardrails. Assign owners per lens.
- Day 7: Socialise the scorecard with the leadership team. Agree the monthly review cadence.
Week 2
- Day 8: Instrument missing metrics with a lightweight data capture. No new tools unless necessary.
- Day 9: Run a dry-run review focusing on three deltas. Document actions and owners.
- Day 10: Finalise the metric dictionary. Version 1.0 published.
- Day 11: Train managers on decision principles, WIP limits and meeting discipline.
- Day 12: Launch the scorecard to teams. Explain why every metric exists.
- Day 13: Kick off two small interventions to move leading indicators. Define expected lag and outcome.
- Day 14: Confirm next month’s review agenda. Lock in who brings what evidence.
Closing argument
Engagement matters, but it’s not the system. Organisational health is the system’s ability to repeatedly deliver outcomes under pressure. Measure it rigorously across Purpose, People, Proposition, Process, Productivity and Potential. Define your metrics. Set guardrails. Review relentlessly. When you can predict outcomes from your leading indicators, you are no longer guessing. You are leading.
Next Steps
Want to learn more? Check out these articles:
Reducing Friction in Team Workflows: Streamline for Success
Mastering Succession Planning for Transformative Leadership Development
Mastering Digital-Age Executive Coaching for Organisational Success
To find out how PerformanceNinja could help you, book a free strategy call or take a look at our Performance Intelligence Leadership Development Programme.